Denmark Key Figures
- Population:
- 5.90 million
- GDP growth rate:
- 3.82 %/year
- Energy independence:
- 60.7%
Data of the last year available: 2022
- Total consumption/GDP:*
- 64.6 (2005=100)
- CO2 Emissions:
- 4.40 tCO2/capita
- Rate of T&D power losses:
- 5.11%
* at purchasing power parity
View all macro and energy indicators in the Denmark energy report
Denmark Related News
View all news, archive your new and create your own daily newsletters only on your topics/countries of interest with Key Energy Intelligence
Denmark Related Research
Benefit from up to 2 000 up-to-date data series for 186 countries in Global Energy & CO2 data
A data overview is available in the global energy statistics app
Total Energy Consumption
Denmark's consumption per capita is slightly lower than the EU average at 2.6 toe/cap and 5 400 kWh/cap of electricity in 2022.
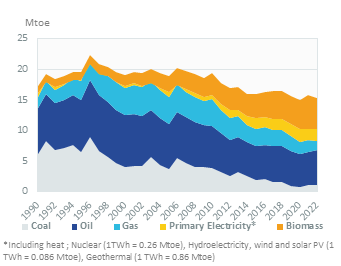
Total energy consumption decreased by 3% in 2022 to 15.4 Mtoe, after a 5% progression in 2021; it increased by 1.5%/year from 2016 to 2018 and declined in 2019 and 2020.
Graph: CONSUMPTION TRENDS BY ENERGY SOURCE (Mtoe)
Interactive Chart Denmark Total Energy Consumption
Benefit from up to 2 000 up-to-date data series for 186 countries in Global Energy & CO2 data
View the detailed fondamentals of the market at country level (graphs, tables, analysis) in the Denmark energy report
Crude Oil Production
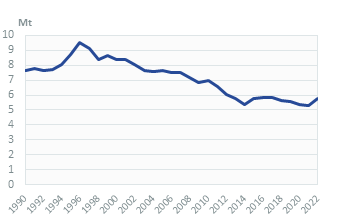
Oil production has been on a downward trend since 2004, decreasing by an average of 10%/year to 3.2 Mt in 2022. Production dropped by 30% in 2020, by 9% in 2021, and by 2% in 2022.
Crude oil exports are following the decline in oil production (0.6 Mt in 2022). Denmark became a net crude oil importer in 2017; net imports have almost doubled since 2010, reaching 4.5 Mt in 2022. Imports of refined products declined from 7 Mt in 2020 to 6.1 Mt in 2022.
The country has two refineries: AS Dansk Shell-Fredericia (68 kb/d) and Dansk Statoil AS-Kalundborg (108 kb/d).
Interactive Chart Denmark Crude Oil Production
Benefit from up to 2 000 up-to-date data series for 186 countries in Global Energy & CO2 data
Additionally, for more detailed information on refineries, you can request a sample of our EMEA Refineries Dataset
Oil Products Consumption
Oil consumption increased by 5% in 2022 to 5.6 Mt, after dropping by 6% in 2020 and relative stability between 2015 and 2019.
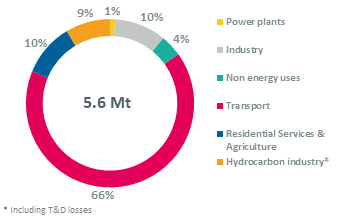
Transport absorbs 66% of oil product consumption (2022), followed by industry (10%) and residential services and agriculture (10%).
Graph: OIL CONSUMPTION (Mt)
Graph: OIL CONSUMPTION BREAKDOWN BY SECTOR (2022, %)
Interactive Chart Denmark Refined Oil Products Production
Benefit from up to 2 000 up-to-date data series for 186 countries in Global Energy & CO2 data
Additionally, for more detailed information on refineries, you can request a sample of our EMEA Refineries Dataset
Natural Gas Consumption
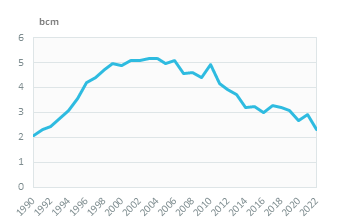
Gas consumption decreased by 20% in 2022 to 2.3 bcm, after a 7% increase in 2021 and a 13% drop in 2020. After a peak at 5 bcm in 2010, it declined by 10%/year between 2010 and 2014 and remained stable at around 3.2 bcm over 2014-2019.
In 2022, the residential, services, and agriculture sectors accounted for 31% of gas consumption, followed by industry (30%) and power generation (12%).
Graph: NATURAL GAS CONSUMPTION (bcm)
Interactive Chart Denmark Natural Gas Domestic Consumption
Benefit from up to 2 000 up-to-date data series for 186 countries in Global Energy & CO2 data
Additionally, for more detailed information on the LNG trade, you can request a sample of our EMEA LNG Trade Dataset
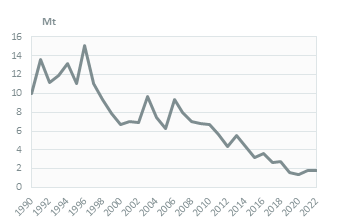
Coal Consumption
Coal consumption is almost exclusively used by the power sector (91% in 2022). It increased by 3% in 2021 and remained stable in 2022 at 1.9 Mt. It dropped by 85% (13%/year) between 2006 and 2020, due to the surge in wind generation and the conversion of coal-fired units to biomass.
Graph: COAL CONSUMPTION (Mt)
Graph: COAL CONSUMPTION BREAKDOWN BY SECTOR (2022, %)
Interactive Chart Denmark Coal and Lignite Domestic Consumption
Benefit from up to 2 000 up-to-date data series for 186 countries in Global Energy & CO2 data
View the detailed consumption trends at country level (graphs, tables, analysis) in the Denmark energy report
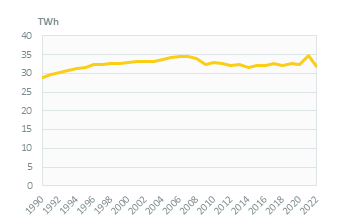
Power Consumption
In 2022, electricity consumption decreased by 9% to 32 TWh. It remained broadly stable between 2015 and 2020 at around 32 TWh before increasing by 7% in 2021 to nearly 35 TWh.
The residential sector and services are the two largest consumers of electricity consumption, with 31% and 28%, respectively, followed by industry (26%) (2022).
Graph: ELECTRICITY CONSUMPTION (TWh)
Graph: ELECTRICITY CONSUMPTION BREAKDOWN BY SECTOR (2022,%)
Renewable in % Electricity Production
The target of the 2012 Energy Agreement to raise the share of renewables to more than 35% of final energy consumption in 2022 was reached in 2018 (35.7%). In 2022, the share of renewables in final energy consumption reached 41.6%, of which 69.4% was used for electricity, 50.1% for heating and 10.2% for transport and district heating. In electricity and district heating, wood (40%), wind (34%), and biodegradable waste (10%) dominated the mix.
Interactive Chart Denmark Share of Renewables in Electricity Production (incl hydro)
Benefit from up to 2 000 up-to-date data series for 186 countries in Global Energy & CO2 data
Learn more about renewables in the European Battery Market Analysis
CO2 Fuel Combustion/CO2 Emissions
The Climate Act (2019) set a target to reduce GHG emissions by 70% in 2030 compared to 1990 and to reach carbon neutrality by 2050; the upcoming NECP advances the carbon neutrality target by 5 years to 2045 and reduces emissions by 110% in 2050.